Benefits Benchmarking
With Benefits Benchmarking you will now be able to generate reports to better understand and explain benefits products within the industry and your firm.
RiskMatch: Benefits Benchmarking provides employee benefits analytics and benchmarking, leveraging hundreds of thousands of plans in the BenefitPoint RiskMatch data pool. It provides Cumulative and Multi-Category Benchmarking data to support renewal and new client engagements so that employers get a clear picture of the competitiveness and cost effectiveness of their benefits packages.
- With Multi-Category Benchmarking you can isolate up to 5 categories that can be benchmarked against independently with a 6th category of aggregate showing the sum of all policies across the 5 selected categories. This allows for more robust reporting when there is limited data available for the Cumulative Benchmarking Report.
- RiskMatch provides more flexible filtering on important plan attributes like high-deductible plans.
Benefits Benchmarking
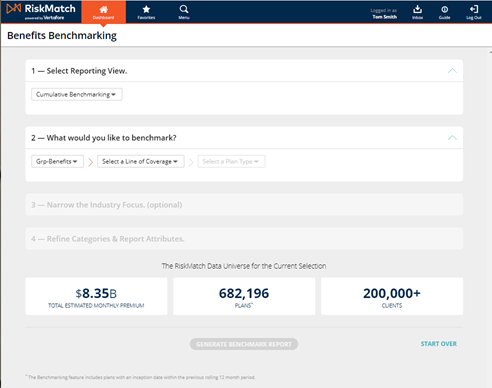
Here you will enter the criteria for your benchmarking report. Below we will walk through the process of setting up the Cumulative and Multi-Category Benchmarking reports. Click here to review the RiskMatch Data Universe.
Bench Marking Report

|
Note: The Report will not generate if there is less than five policy matches with at least three different brokers writing those five policies.
|
-
Under the Select Reporting View section, click Cumulative Benchmarking.
Cumulative Benchmarking
-
Under the What would you like to benchmark section, you have the option to select a plan type. Click on A Plan Type, continue by selecting a product segment and line of coverage from the drop-downs.
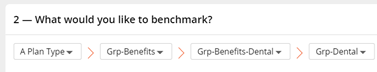
Plan Type
-
Next, you have the option to Narrow the Industry Focus. Select an Industry Group, and then choose any filters you want to add.
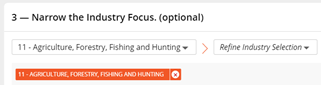
Industry focus
-
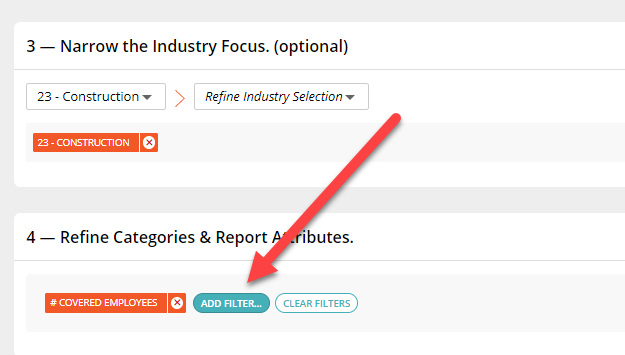
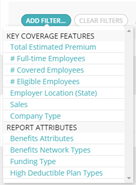
Finally, you can add filters to Refine Categories & Report Attributes. Click on Add Filter and choose options from either Key Coverage Features or Report Attributes. When you are finished adding filters, click Generate Benchmark Report.

Add Filter
Filtering Benefits Attributes
NOTE:This is filtering benefits attributes for Cumulative Benchmarking.
-
Select Add Report Attributes under "4 - Refine Categories & Report Attributes"
-
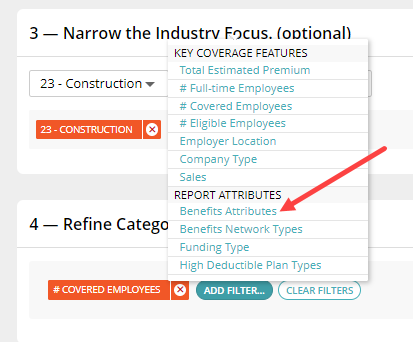
Select, from the pop-up, Benefits Attributes under "Add Filter".
-
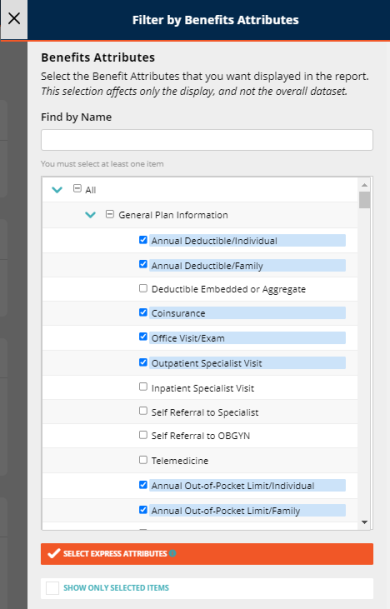
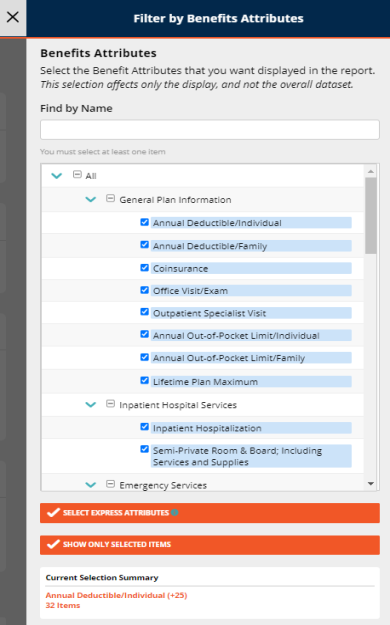
Select, from the pop-up, the attributes you would like to show up on the report. There are multiple ways to do this. You can either click each desired attribute, or you can click Select Express Attributes to auto-select attributes based on the plan type.
NOTE: If you click Select Express Attributes you can still select or deselect desired attributes from the pop-up.
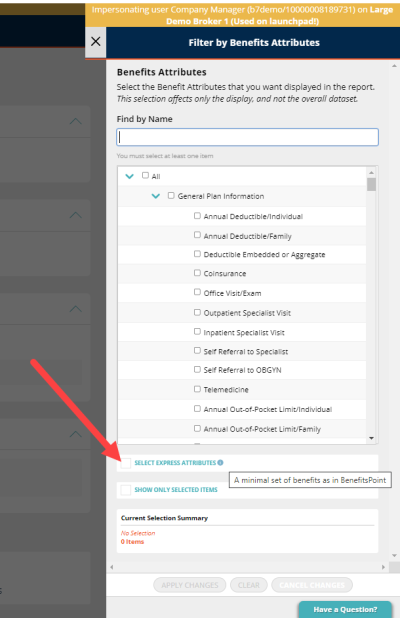
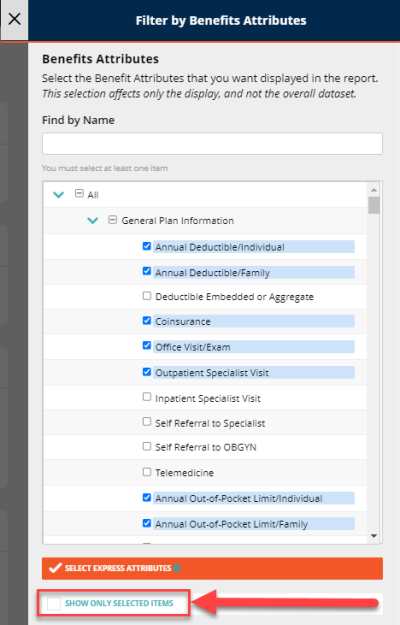
NOTE: Selecting the Show Only Selected Items at the bottom of the window will filter to only the selected attributes.
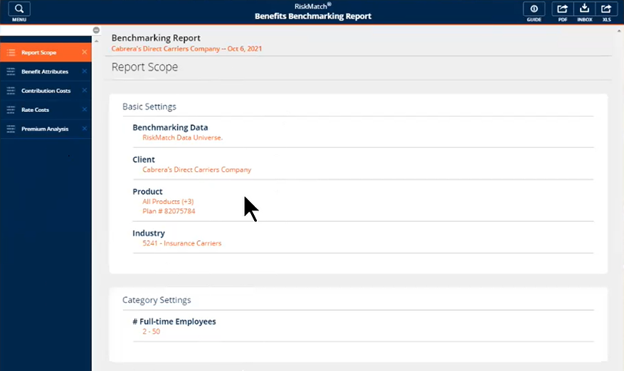
Report Scope
-
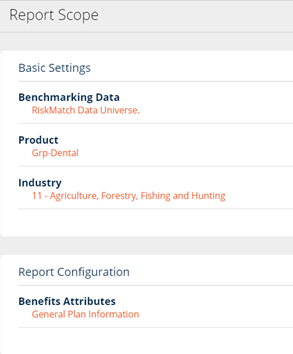
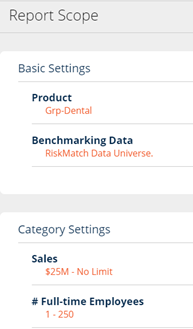
This is an overall look of the report you just generated.
-
It will include all the exposure setting selected from the previous criteria page.
-
Report Scope
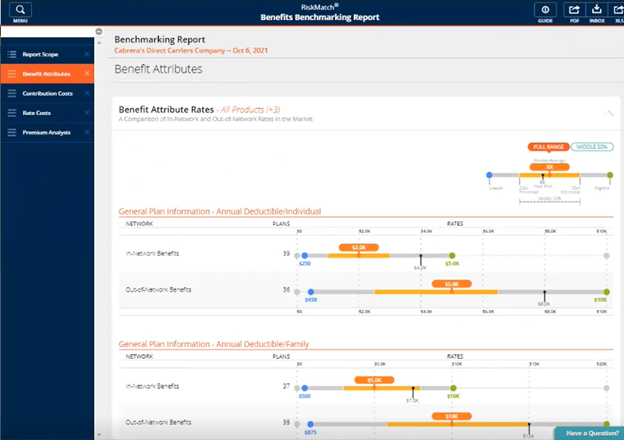
Benefit Attributes
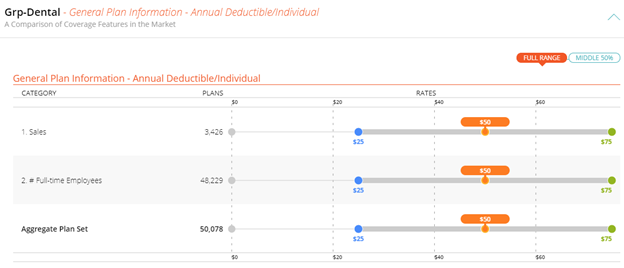
- This report shows the breakdown of the various benefits attributes underneath the benefit plan. The concept behind this is to break down the information to the producer and the client and show what attributes the selected product typically contains and the various costs or coverage they provide.
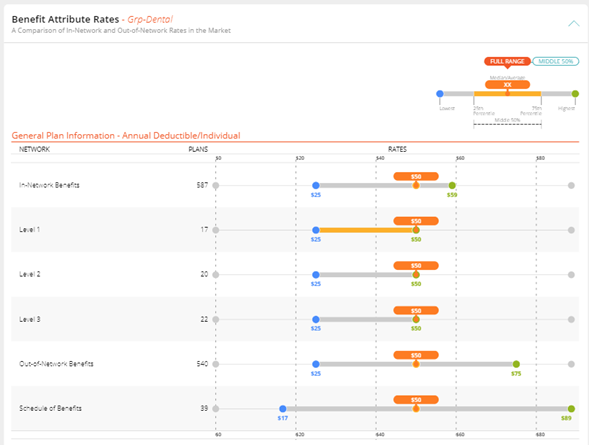
Benefits Attributes
-
You can go into more depth by hovering over a Plan to see the Breakdown of your plan by percentiles.
-
The highlighted $50 on the graph below is the median percentile of the report.
-
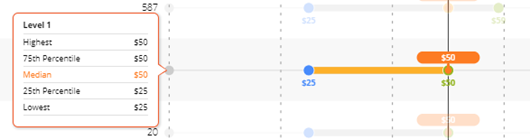
Percentiles
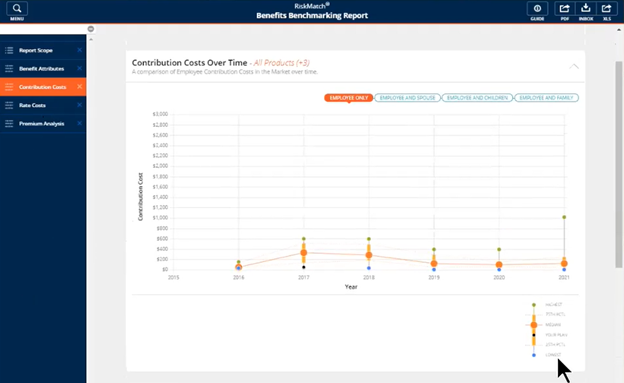
Contribution Costs
-
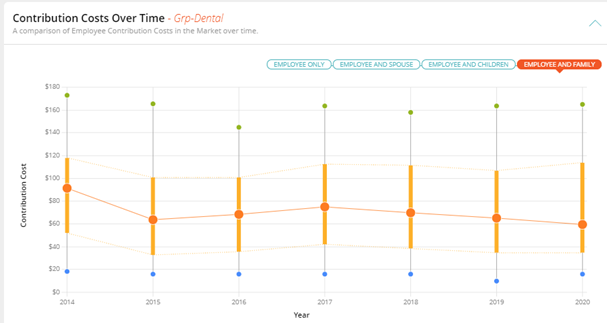
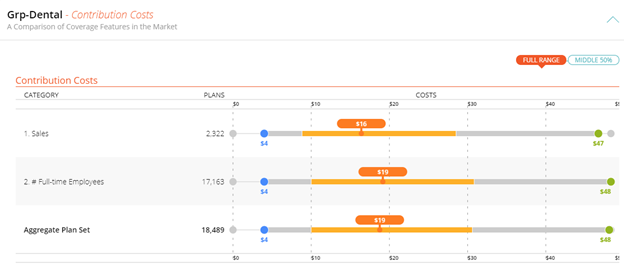
This report shows what an employee pays for their benefits if they choose to sign up for that insurance plan.
-
You can see the breakdown of the benefits costs for employee’s year over year, across a 6-year time spread. This is to show customers and producers the overall trend across the years as well as any current market effects on costs to the employee.
Contribution Costs
-
You can switch views by clicking on the options above the graph.
-
Employee Only
-
Employee and Spouse
-
Employee and children
-
Employee and Family
-

Contribution Costs: Options
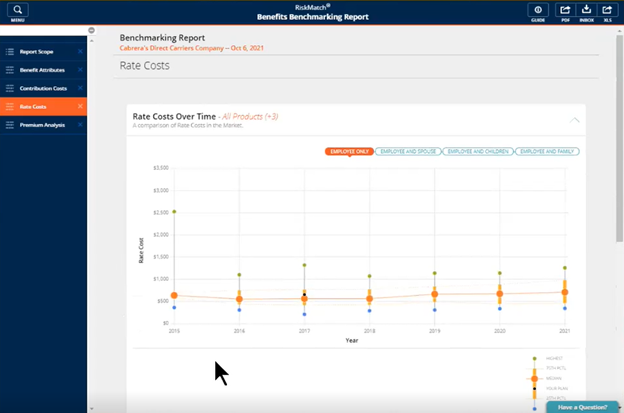
Rate Costs
-
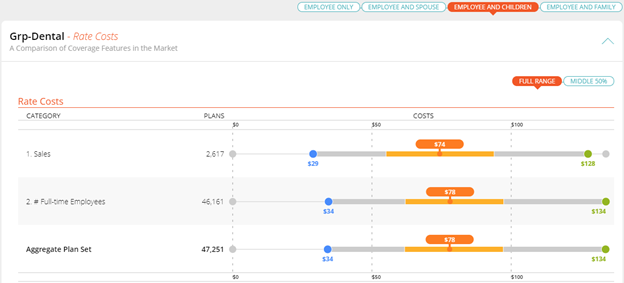
This report shows a year over year view of the various rates that the different rate tiers cost. This will show the overall costs of the benefits plan as rates are the cost per benefit group for the insurance coverage.
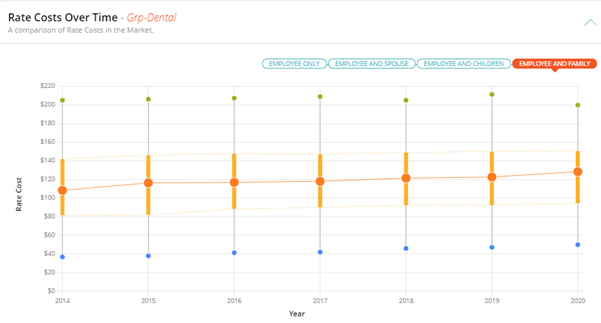
Rates Cost
-
You can switch views by clicking on the options above the graph.
-
Employee Only
-
Employee and Spouse
-
Employee and children
-
Employee and Family
-

Rate Costs: View Options
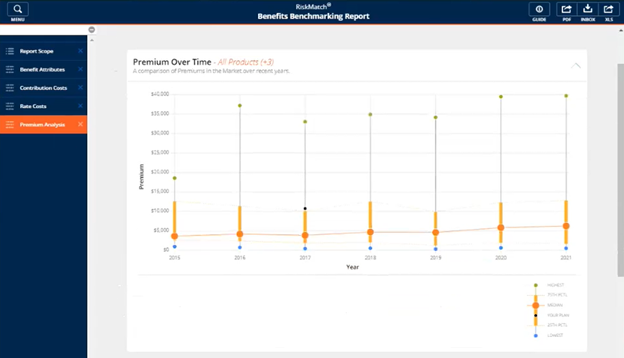
Premium Analysis
-
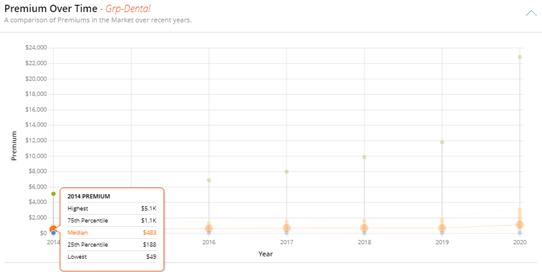
This report displays the changes in premium year over year for the selected product.
-
This report estimates the total monthly premium (not for one employee, but for all employees) to calculate premium over time.
Premium Analysis
Within the Cumulative Benchmarking reporting view of Benefits Benchmarking, users can now benchmark against existing clients in addition to a plan type.
Creating the Report
-
Under the Select Reporting View section, select Cumulative Benchmarking.
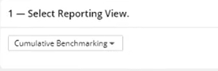
Cumulative Benchmarking
-
Under the What would you like to benchmark? section, select An Existing Client and type the client’s name in the search box. A number of clients will show, choose the correct client.
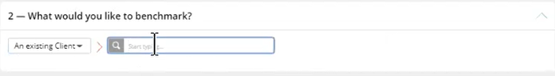
An existing Client
-
The Confirm the Client’s Industry section will autofill based on information stored in RiskMatch.
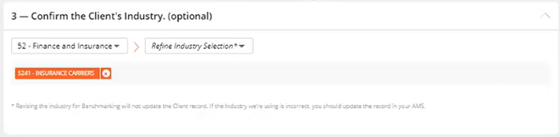
Confirm the Client's Industry
-
Next, use the Narrow the Product Focus section to select a product to benchmark from the client’s available products.
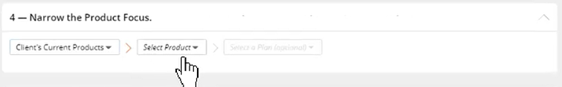
Narrow the Product Focus
The Refine Product Selection window will pop up on the right side of the screen. Select the product you wish to benchmark and click Apply Selection.
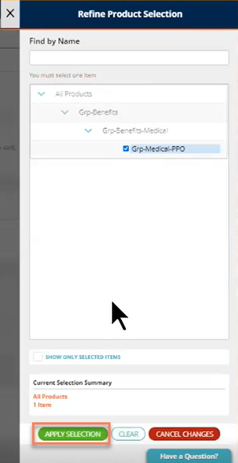
Refine Product Selection
Next, select the specific plan you would like to compare to.
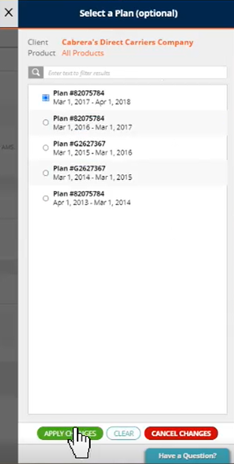
Select a Plan
-
Refine your filters under the Refine Categories & Report Attributes section to perfect your dataset and select Generate Benchmark Report. If there are fewer than five plans you may need to remove filters in step 5 or 3.
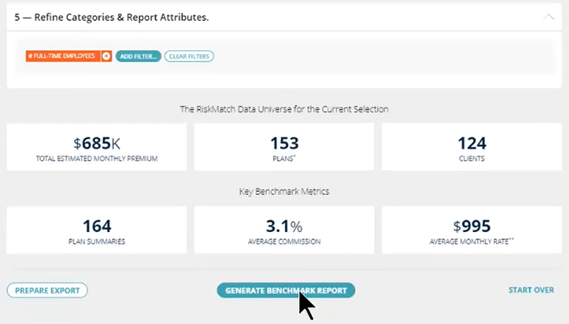
Refine Categories & Report Attributes
Report Features
Report Scope
The Report Scope page provides an overview of the options selected in the previous steps to generate the Benchmark Report.
Report Scope
Benefit Attributes
The Benefit Attributes page breaks down how your client’s plan compares against the similar plans from the RiskMatch universe using the median, low, and high values for various plan attributes. A black indicator points to the plan of comparison.
Benefit Attributes
Contribution Costs
The Contribution Costs page uses a line graph to compare your plan’s contribution costs over time to those of the incumbent plans you are benchmarking against. A black indicator points to the plan of comparison.
Contribution Costs
Rate Costs
The Rate Costs page uses a line graph to compare your plan’s rate costs over time to those of the incumbent plans you are benchmarking against. A black indicator points to the plan of comparison. It also contains tables with more detailed information on the rate costs over time and number of plans over time.
Rate Costs
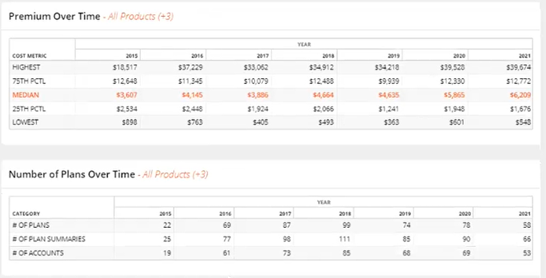
Premium Analysis
The Premium Analysis page uses a line graph to compare your plan’s premium over time to those of the incumbent plans you are benchmarking against. A black indicator points to the plan of comparison. It also contains tables with more detailed information on the premium over time and number of plans over time.
Premium Analysis
Exporting the Report
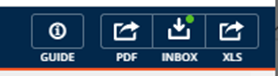
You can export the report as a PDF or XLS file using the buttons at the top of the window. XLS reports appear in your RiskMatch inbox.

Export Options
- Under the Select Reporting View section, click Multi-Category Benchmarking.
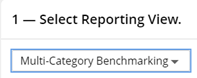
Multi-Category Benchmarking
-
Under the Which Plan Type would you like to benchmark section, select a line of coverage and a plan type from the dropdowns.
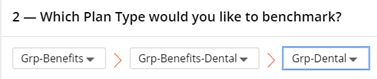
Grp-Benefits
-
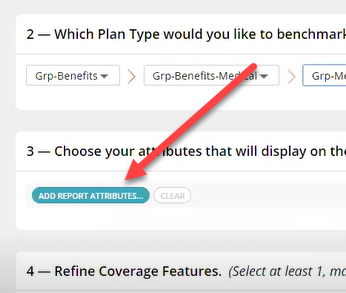
Next, choose you attributes that will display on the report. Click Add Report Attributes and select your attributes.
Choose Attributes
-
Finally, you can add filters to Refine Coverage Features. Click Add Coverage Feature and choose your coverage features. When you are finished adding filters, click Generate Benchmark Report.
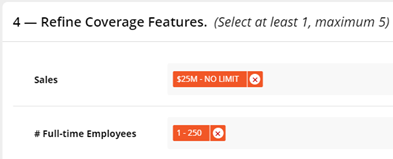
Refine Coverage Features.
Filtering Benefits Attributes
NOTE:This is filtering benefits attributes for Multi-Category Benchmarking.
-
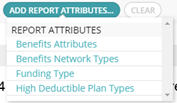
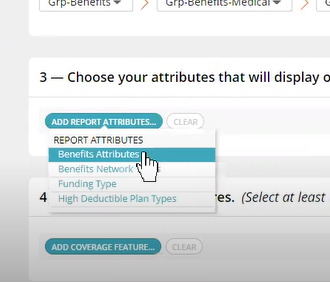
Select Add Report Attributes under "3 - Choose your attributes..."
-
Select, from the pop-up, Benefits Attributes under "Add Report Benefits".
-
Select, from the pop-up, the attributes you would like to show up on the report. There are multiple ways to do this. You can either click each desired attribute, or you can click Select Express Attributes to auto-select attributes based on the plan type.
NOTE: If you click Select Express Attributes you can still select or deselect desired attributes from the pop-up.
NOTE: Selecting the Show Only Selected Items at the bottom of the window will filter to only the selected attributes.
Report Scope
-
This is an overall look of the report you just generated.
-
It will include all the exposure setting selected from the previous criteria page.
-
Report Scope
Overview
-
This is an overall view looking at each category you selected. It shows the Minimum, 25% Percentile, Median, 75% Percentile, and Maximum value for each category as well as the aggregate values for all the data from the categories you selected.
Overview
Contribution Costs
-
This report shows an overview of the various contributions that the different contribution tiers cost. It is broken out by each category selected in the criteria. This will show the overall costs of the benefits plan as contributions are the monthly cost per person per benefit group for the insurance coverage.
Contribution Costs
Rate Costs
-
This report shows an overview of the various rates that the different rate tiers cost. It is broken out by each category selected in the criteria. This will show the overall costs of the benefits plan as rates are the monthly cost per person per benefit group for the insurance coverage.
Rate Costs
-
You can switch views by clicking on the options above the graph.
-
Employee Only
-
Employee and Spouse
-
Employee and children
-
Employee and Family
-

Rate Costs: View Options
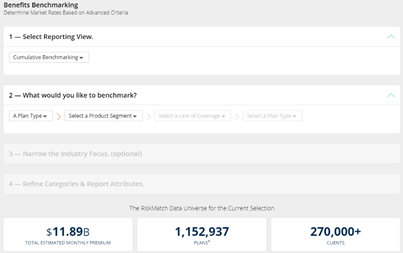
RiskMatch Data Universe
-
This information appears at the bottom of your Benchmarking Report before the report is generated.
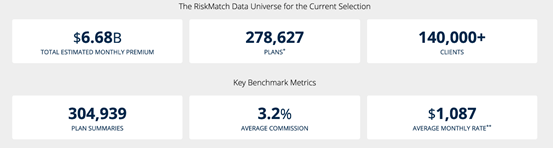
RiskMatch Data Universe: Current Selection
-
Total Estimated Monthly Premium: Sum of the Estimated Monthly Premium from the policies within the data set.
-
Plans: A count of the policies in the dataset.
-
Clients: A count of the clients in the dataset.
Key Benchmarking Metrics
-
# of Plan Summaries: A sum of the Plan Summaries that are in all the policies.
-
Average Commission: An average of the commission rates for all matching policies within the data set.
-
Average Monthly Rate: Average Monthly Rate per 1 employee calculated across all rate schedules and rate tiers.
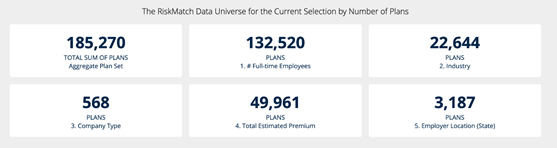
RiskMatch Data Universe: Number of Plans
-
Aggregate Plan Set: The sum of all policies (does not count duplicate policies) in the selected plans.
-
Criteria 1-5: The count of all policies within the selected criteria.
Export Report
-
Click the PDF button in the top right corner to export your Report to PDF or the XLS button to export your Report to XLS. XLS reports appear in your RiskMatch inbox.
Export to PDF
Hide Sections from Report
-
If you want to exclude a section from your report export, click the X next to the section before exporting the report. To bring it back, simply click on the removed section before exporting the report.
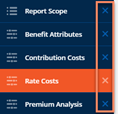
Remove Section
PLANS VS. POLICIES
• Benefits Benchmarking does not use the term policy and instead refers to them as plans. Plans are things like medical plans, dental plans, and other insurance offerings sold to customers.
FILTER MAPPING
• The Benchmarking Report pulls data from both the RiskMatch data pool and Dun & Bradstreet:
Add Filter
Dun & Bradstreet:
- Industry
- Sales Size
For optimal performance of the application, we recommend the following as a minimal configuration:
| HARDWARE/SOFTWARE | MINIMUM REQUIREMENTS/RECOMMENDATIONS |
| Processor/CPU Speed |
Recommended: i5, i7 or Multi-core: 2.6 Ghz or above Minimum: Core 2 Duo: 2.3 Ghz or above Not supported: Single Core, Reduced feature CPUs, such as Celeron or AMD Sempron |
| Memory: |
Recommended: 4GB Minimum: 2 GB |
| Hard Drive Space | Minimum: 150Mb of local disc space per user |
| Video | Minimum: Resolution 1024x768 with 16-bit high color or better |
| Operating System |
Recommended: Windows 10 (64-bit) Minimum: Windows 7 (32-bit) |
| Microsoft Office (Word, Excel) |
Recommended: Office 365 *Excel 2010 Professional or higher |
| Google Chrome | Latest Version Supported |
| Microsoft Edge | Latest Version Supported |