Growth Insights
Growth Insights is a new cross-sell benchmark feature that provides a way to create campaigns based upon the RiskMatch cross-sell machine learning model; it depicts your agency’s penetration of selling products to an industry as compared to the rate of penetration across all of RiskMatch.
The Growth Insights Report can be accessed in the Standard Reports area of RiskMatch. Standard Reports choices appear above the Inbox within RiskMatch
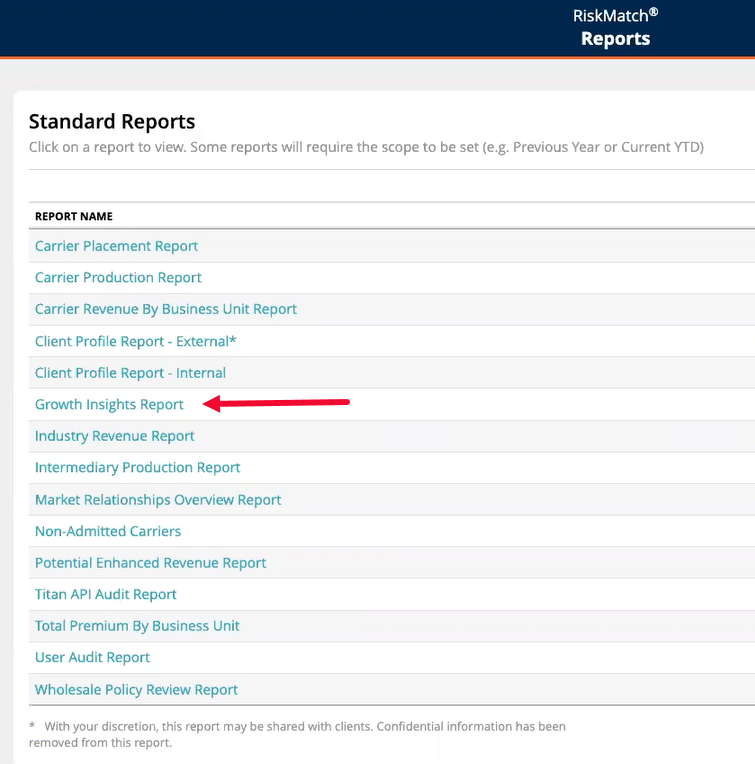
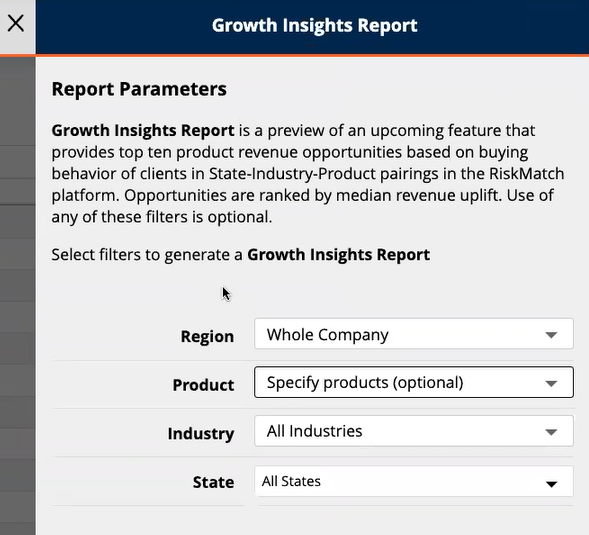
A description of the Growth Insights report is contained within the report parameters selection panel. You may choose to keep the report parameters unchanged and not specified; this allows the machine-learning model to choose the top ten revenue opportunities for clients with whom you have access. Alternatively, you can use drop-down menus to specify Region, Product, Industry and/or State.
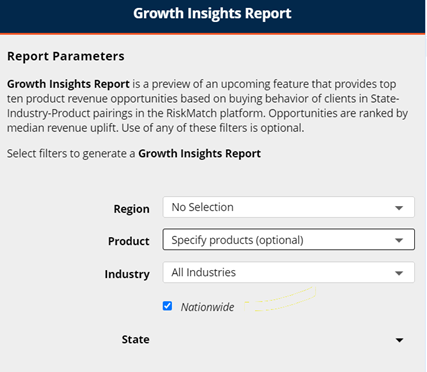
Nationwide Reporting
The Nationwide check-box, located above the "State" drop-down selection, allows for the analysis of growth insights on an aggregated national level. In other words, all states where you are doing business will be analyzed for the growth insights Top Ten recommendations.
After running the Growth Insights Report, an Excel file will appear in your RiskMatch Inbox. Within this Excel file, a tab for Criteria records basic information about the report; meanwhile, the next four tabs provide an overview of the top ten opportunities and details, grouped by account owner and producer. The final tab, labeled "All Opportunities," shows details on all opportunities so that you may filter to the desired information.
The Top 10 Opportunities tab provides an overview of Growth Insights by showing a table and ten graphs. The Opportunities table depicts the following elements:
-
Industry segments to sell to
-
Which products to sell
The table also shows the total client count of policies to sell, plus a range of dollar amounts of total revenue uplift, based upon data derived from the RiskMatch data lake.
Graphs are ordered by your agency’s Market Penetration Percentage. The title of the graph is written in the form of Sell X (the product) to Y (an industry) clients in Z (where, usually referencing the state).
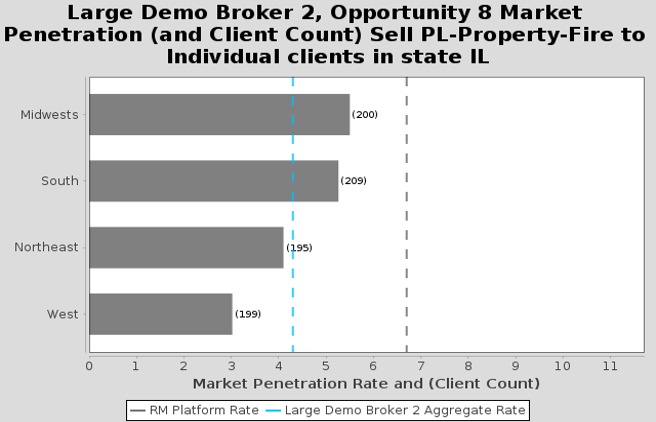
Each horizontal bar chart shows market penetration, there the vertical lines indicate market penetration of your agency (blue line) and the RiskMatch platform rate. The gap between the blue vertical dotted line and the black vertical line is the measure to close with product sales. This is the Growth Insight of under- and over-performance.
This initial report marks the beginning of the new Growth Insights feature. Continued enhancements may include design changes to the report, plus the release of an external API so your agency can further leverage the power of machine learning.