MarketTrends
Vertafore’s MarketTrends leverages over $65 billion of commercial and personal lines of premiums in the RiskMatch Data Universe to aid brokers and agents in the renewal process.
- AM Best: A credit ratings agency focused on the insurance industry.
- AM Best Number: The AM Best company ID.
- AM Best Rating: AM Best’s measure of an insurance company’s financial solvency. Ratings are scaled superior (A+/A++) to poor (D/-). Also known as the Financial Size Rating (FSR).
- Cost as a % of Gross Revenue: Written premium divided by insured annual sales size.
- Financial Size: AM Best’s measure of an insurance company’s equity (assets minus liabilities). Categories are scaled I to XV. Also known as the Financial Size Category (FSC).
- MGA/Wholesaler: An insurance intermediary operating between brokers and carriers to help place coverage.
- Multi-layer Excess: Tiered liability covering the excess layers of loss. Insurers are more insulated from potential losses and in turn receive lower premiums for excess layers.
- Multi-layer Primary: Tiered liability covering the primary layer of loss.
- North American Industry Classification System (NAICS): A standardized industry hierarchy of 2-digit industry groups and corresponding 3-6-digit industry subgroups. A 6-digit NAICS code is a more specialized definition than a 3-digit code. We suggest refining reports by industry groups for industry subgroups which do not contain enough data to generate a report.
- Rate: Premium per one million dollars of limit.
- Single Layer: When the risk is covered by one insurer. There are no tiers of coverage/loss.
- Writing Company: The insurance company that binds the policy.
All users are presented with the same landing page which provides suggested use cases for each report component.
-
Click Get Started to begin filtering report criteria.
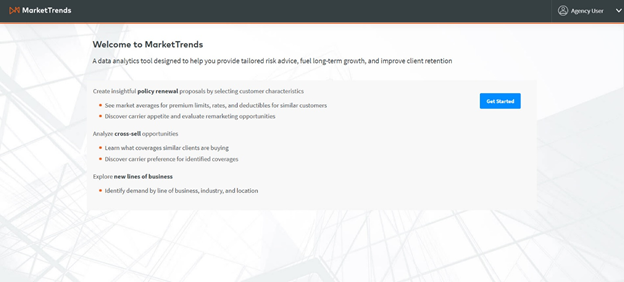
Landing Page
The Renewal Report shows policy exposure metrics matching the selected report criteria. All commercial and personal lines policies on RiskMatch with an inception date in the past 12 months are included in the analysis. This represents more than $65 billion of written premiums and over 122 million policies. Due to data privacy restrictions, values will only be shown in reports if there are greater than 25 policies containing the given value.
Report Criteria
You must select at least one line of business (LOB) and industry to generate the report. All other filters will default to automatically include all selections if no selection is made.
Be sure to refine the report criteria to view MarketTrends for the selected policy and client demographics.
Lines of Business
You must first select a LOB Category (supergroup) from the drop-down before being able to search by LOB. The below super groups are available for selection:
- Commercial
- Personal Lines
To select a minimum of 1 and maximum of 3 Lines of Business, users should:
-
Click on the LOB category drop-down.
-
Select a maximum of 1 LOB Category from the drop-down.
-
Either search for the LOB by name or expand the LOB tree. All product groups will default to closed. You will have to select a minimum of one and a maximum of three LOBs.
-
After an LOB is expanded, the collapse all button becomes enabled. After you’ve made a selection, the Clear Selections button will become enabled.
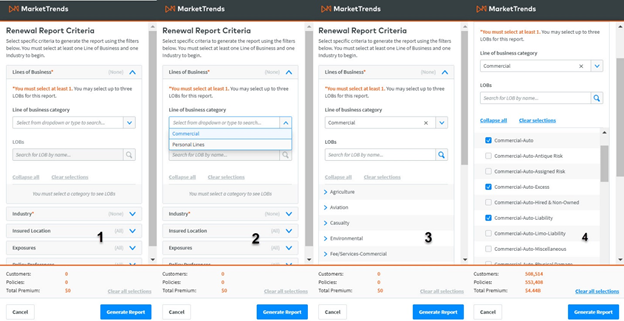
Renewal Report Criteria: LOB
The bottom navigation bar shows the total number of policies, premium and unique clients found in the dataset. Metrics will refresh after you select/deselect a node(s) within the tree.
Industry
Vertafore MarketTrends uses the NAICS industry hierarchy. You must select at least one 2-digit industry group. Once you have selected an industry group, you must select a minimum one industry from the tree. You can select the entire industry group or any combination of industries within an industry group.

|
Note: SIC codes are not supported. Find the equivalent NAICS if needing to search by SIC. |
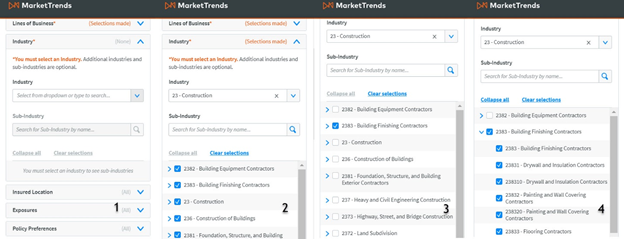
Renewal Report Criteria: Industry
To make an industry selection, you should:
-
Click the Industry drop-down.
-
Select 1 industry from the drop-down.
-
Either search for sub-industry by name or expand the group tree. All the groups will default to closed. If you begin to search, all the groups matching the search criteria will be expanded.
-
After an industry is expanded, the Collapse All button becomes enabled. After you select an industry, the Clear Selections button becomes enabled. The bottom navigation bar will update to reflect the metrics of the selected industries.
Insured Location
The insured location refers to the state of the customer's address. This may differ from the customer's Risk Location.
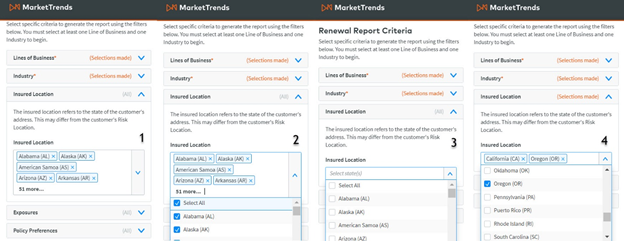
Renewal Report Criteria: Insured Location
-
The Insured Location drop-down will default to closed.
-
Click Select All to remove all the states.
-
You can either search for a state name or expand the drop-down.
-
You will see the selected states appear in the search bar.
-
Either click the x next to state names within the search bar or uncheck states in the drop-down to remove selections.
Exposures
Filters for company sales and number of employees are included for every LOB:
- Company sales [$ min] - [$ max]: The annualized revenue of the insured. You may enter a minimum or maximum value or both.
- Number of employees [$ min] - [$ max]: The number of persons employed by the insured. You may enter a minimum or maximum value or both.
LOB Specific Exposures
Certain exposures will only appear for supported lines of business. For example, the exposures listed below will appear for commercial auto products.
- Location ZIP codes: The zip codes of insured risks.
- Number of locations: The number of risk locations for the insured.
- Number of vehicles: The number of insured vehicles on a policy.
- State of Drivers’ Licenses: This is for commercial auto lines of business. Choose to filter by the state(s) of insured’s drivers’ licenses.
- State of Drivers’ Vehicle Registration: This is for Commercial Auto LOBs and the state where the vehicle is registered.
- Vehicle Class Codes: The US Department of Transportation’s categories based on a vehicles weight. Scaled Class 1 (<6,000 lbs) to Class 8 (>33,000 lbs).
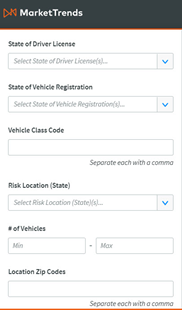
LOB Exposures
Policy Preferences
-
Deductible / SIR Value[$ min] - [$ max]: The out-of-pocket cost to the insured before coverage begins. You may enter a minimum or maximum value or both.
-
Limit Value [$ min] - [$ max]: The Maximum dollar amount paid on a potential claim. You may enter a minimum or maximum value or both.
-
Premium Value [$ min] - [$ max]: The cost to the insured for coverage. You may enter a minimum or maximum value or both.
-
Policy Type: Layered (whether the policy includes a layer for excess loss) or non-layered.
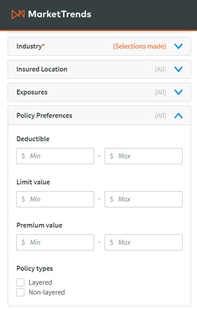
Policy Preferences
Clearing the Report:
Click Clear all selections in the bottom nav bar to clear all filters.
Generate Report:
Click the blue Generate Report button in the bottom nav to view the report.
|
|
Note: You will be unable to generate the report if there are fewer than 25 policies matching your selected criteria. |
The report overview provides a breakout of the filter criteria and metrics of the underlying dataset included in analysis.
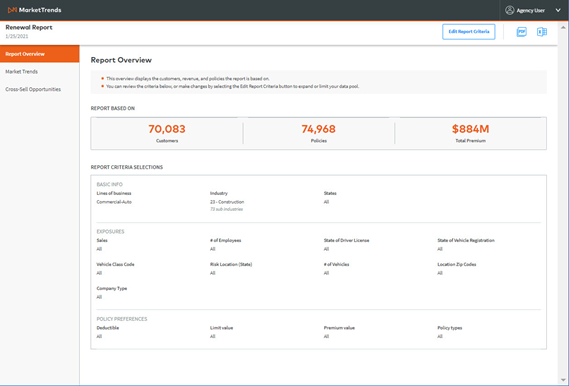
Benchmarking Data Report: Overview
Three metrics are provided at the top of the page:
- Customers: The total number of customers used in analysis.
- Policies: The total number of polies included in analysis.
- Total Premium: The sum of all policy premiums included in analysis.
Report Criteria shows the policy and client criteria used to generate the report on the previous page. The page is split into three sections:
- Basic Info – This includes the following client-level demographics: Lines of Business, Industry, Company Type, and States.
- Exposures – This includes general exposures plus exposures specific to the chosen LOB.
- Policy Preferences – This includes the following policy-specific filters: Deductible, Limit value, Premium value, and Policy types
If you did not specify a selection for a given filter, the report will show All.
Find market distributions for premium, limits, rates, and deductibles and identify carriers and MGAs writing the risk, providing you the data needed to make a competitive renewal proposal.
Total Carrier Data
This section provides an overview of the Lowest value, 25th percentile, Median, Average, 75th percentile, Highest value, and number of policies by premium, limits, rates, deductibles, cost as a % of gross revenue and commission.
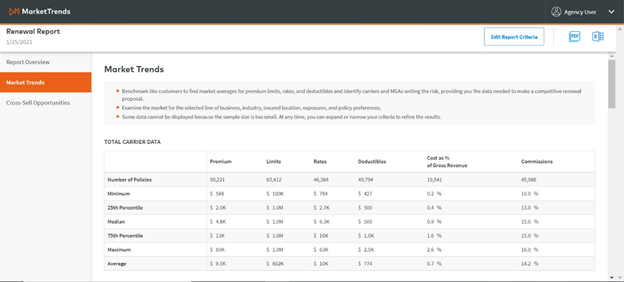
Benchmarking Data Report: Benchmarking
The number of policies row shows how many policies have data entered for corresponding column headers. If there are fewer than 25 policies for any column, we are prevented from displaying output for that column in the report.
Carrier Data by Insured Annual Sales Size
The box and whiskers charts illustrate the distribution of premiums, limits, rates, deductible, and commissions by insured annual sales size. Rate is calculated as the average premium per one million dollars of limit. You can choose to view either the graph or table by toggling the graph/chart icons in the top right-hand corner of the section.
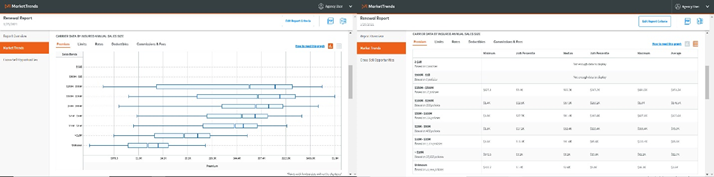
Benchmarking Data Report: Carrier Data by Insured Annual Sales Size
We show the Lowest value, 25th percentile, Median, Average, 75th percentile and Highest value for each of the below sales bands:
-
1B+
-
500M to 1B
-
250M to 500M
-
100M to 250M
-
50M to 100M
-
25M to 50M
-
10M to 25M
-
Less than 10M
-
Unknown
Clients & Policies with Unknown Sales Sizes:
We will display an additional split of no sales size so you can still see policy details when there is no sales size for an associated client/policy is found in the RiskMatch database.
|
|
Note: You will be unable to generate the report if there are fewer than 25 policies matching your selected criteria. |
How to read this graph:
MarketTrends provides in-product support to help you navigate and understand the charts and tables you are viewing.
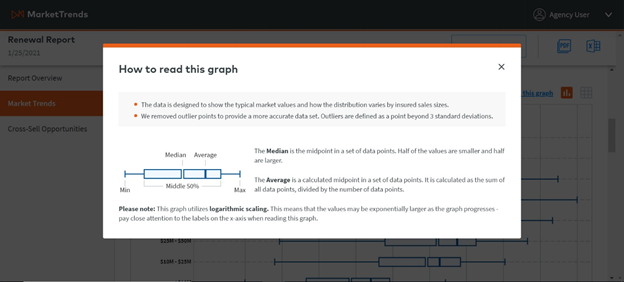
How to read this graph Pop-up
The data is designed to show the typical market values and how the distribution varies by insured sales sizes. We removed outlier points to provide a more accurate data set. Outliers are defined as a datapoints beyond 3 standard deviations. This graph utilizes logarithmic scaling. This means that the values may be exponentially larger as the graph progresses - pay close attention to the labels on the x-axis when reading this graph.
Carrier Data Over Time
This component shows the median premium, limits, rates, and deductibles for the past 6 calendar quarters for:
-
Single Layer policies (non-layered)
-
Multi-Layer Primary (primary layer of coverage)
-
Multi-Layer Excess (first excess-layer of coverage)
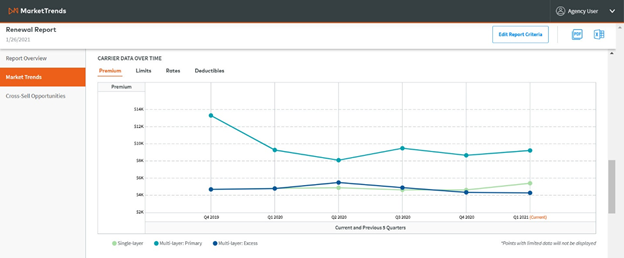
Carrier Data Over Time
|
|
Note: Data is only displayed for quarters containing more than 25 policies. |
Available Carriers
View carrier appetites by total number of policies in the RiskMatch dataset placed with corresponding carriers for the chosen LOB and industry. Columns for AM Best Number, AM Best Rating, Last Rating Date, Rating Change and Financial Size are also included. You can click between Writing Carriers and MGAs & Wholesalers.
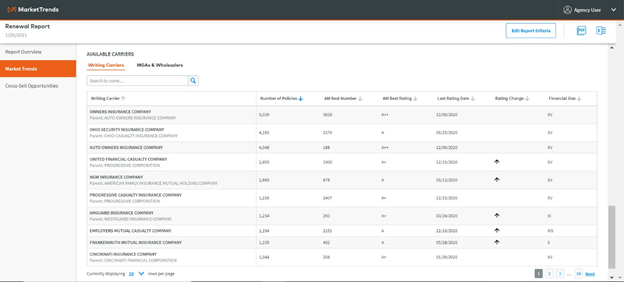
Available Carriers
-
Number of policies: The number of policies matching the selected industry/LOB and placed on RM with the corresponding carrier.
-
AM Best Number: The AM Best Company ID.
-
AM Best Rating: The current AM Best financial strength rating.
-
Last rating date: The last date a company’s rating changed.
-
Rating change: Whether the last rating change resulted in an upgrade or downgrade.
-
Financial size: The current AM Best financial size category.
To view more carriers in the table, change the number of rows per page or toggle between pages in the bottom right-hand corner of the table.
Best Opportunities
The Cross-Sell Opportunities tab allows you to see what similar insureds are buying. Identify coverage gaps and cross-sell opportunities by analyzing like customers, helping you improve retention and increase revenue. We show the top 5 most frequently purchased products and corresponding % who buy for your chosen industry/product combination.
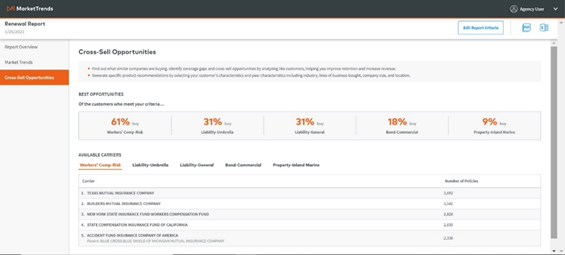
Cross-Sell
Available Carriers
For each product recommendation, we show the top 5 available carriers by number of policies placed with carriers on RiskMatch. The carrier name and parent company name are displayed within the same row, as well as the number of policies. You can click any of the 5 product recommendation headers to see which carriers have the most appetite for the suggested coverage.
|
|
Note: We will only show product recommendations for products with >5% buy. |
Export Report
You may export the report as either a PDF or Excel spreadsheet by clicking the PDF icon in the top right-hand corner of the report.
Edit Criteria
At any time, you may choose to click the Edit Criteria button to reopen the filter criteria side pane. If you click cancel within the pane, the criteria pane will close, and the report overview page will again be shown.

Edit Criteria