Retention Prediction
With Retention Prediction, you will now be able to use predictive analytics to identify and manage your most at-risk renewing policies.
New Features:
- Identification of renewals at risk - early detection and notification of at-risk policies to help you focus your strategy on customers who need the most attention
- Predictive view of policy renewal risk up to 120 days ahead with agency and policy-level details
- Historical view of agency policy retention and benchmarking against other agencies
Retention Prediction
-
From the RiskMatch dashboard, click on Menu. Then, under the Analytics section, click on Retention Prediction.

Menu
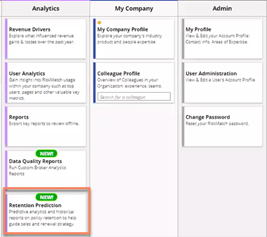
Retention Prediction
-
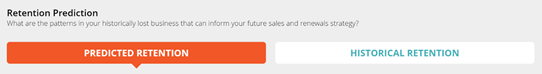
You will notice the Report pops up on the right. From here you will be able to choose between two sections, Predicted Retention and Historical Retention.
User Roles
This feature is accessible to RiskMatch users with the following user roles:
- Global Manager, who sees the Whole Company view of the data
- Manager, who sees the renewal data pertaining to their divisions (i.e. area of oversight)
- Practice Leader, who sees the renewal data pertaining to the Products for which they are the leader
- Industry Leader, who sees the renewal data pertaining to the industries (via 3 or 4-digit NAICS codes as appropriate) for which they are the leader.
Machine Learning Model and Policy Exclusions
RiskMatch Retention Prediction uses a machine learning model trained on 200 different features to estimate a policy’s risk of being lost. We consider policy information, agent profile, agency/brokerage profile, customer profile, customer behaviors, and external factors (including those that reflect the impact of COVID-19).
Typically, the top factors affecting retention include:
- Policy premium vs. the market
- Broker retention rate
- Market retention rate

|
Note: By "market" we mean similar canonical products in the state where the policy is written. |
The Model Accuracy metric on the Historical Retention pane indicates how well the model has correctly estimated outcomes based on a sample of historical data. For example, a model accuracy of 85% states that the model correctly classified the actual outcome (either retention or loss) with that degree of frequency and therefore is likely to be correct in 85% of predictions on upcoming policy renewals and losses.
Retention prediction modelling excludes the following products:
- Bonds
- Construction / Builders Risk: Owner Controlled Insurance Program (OCIP/Wrap Up), Construction/Contract, Marine-Builders Risk, PL-Property-Builders Risk, Installation, Excess
- Events: Cancellation, Hole In One, Liability, Non-appearance, Personal Lines Special Events, Weather
- Run Off / Closeout
- Other: Benefits, Fees, Services, Commission Rebates, Liability-Railroad Protective, Title Insurance, Unknown Product types, and any product that is not recognized by RiskMatch
And the following policies:
- Policies marked as legacy
- Policies with zero/negative premium
- Policies with incomplete client name and zip code
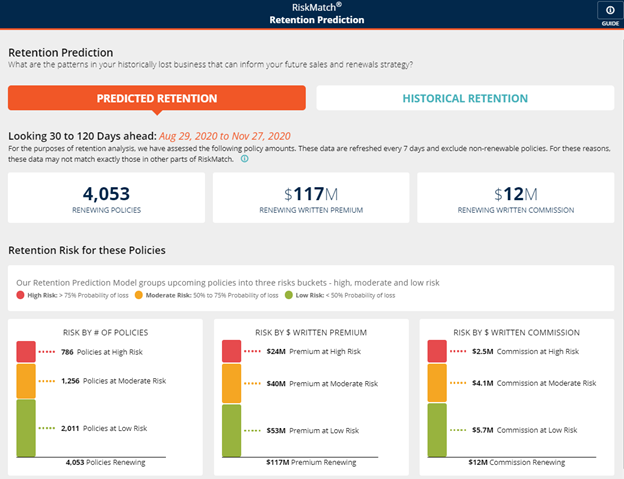
- This section provides a forward-looking view on your potential renewal risks. These are predicted using Vertafore’s retention prediction machine learning model.
Predicted Retention
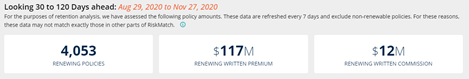
30-120 Day View
-
Here you will be able to review:
-
Renewing Policies: How many renewals are due during this period
-
Renewing Written Premium: How much your policies are worth in written premium
-
Renewing Written Commission: How much your policies are worth in written commission
-
30-120 Day View
-
Your view is up to 120 days away. This will better equip your agency to address any upcoming renewals as you begin renewal conversations.
|
|
Note: The numbers above are NOT in real time but are refreshed every 7 days. You can expect minor deviations between the numbers in other parts of RiskMatch. |
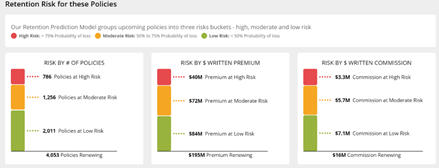
Risk Profile
-
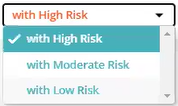
Here you will be able to review the predicted degree of risk in your upcoming renewals. These are categorized as:
-
Red: High Risk (greater than 75% risk of loss)
-
Yellow: Moderate Risk (between 50%-70% risk of loss)
-
Green: Low Risk (less than 50% risk of loss)
-
Retention Risk
Risk Reports
-
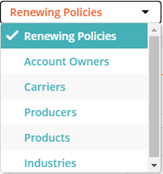
Drill down into the detail of the renewals and analyze them from different perspectives.
-
Categories:
-
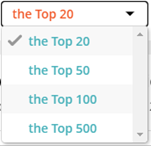
Top Number

-
Data View
-
Risk Level
-
Sorting Criterion
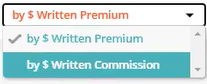
-
-
When you are ready to view your table, click on Show.

Risk Reports
-
You can also choose to include or exclude certain columns by clicking on the filter results tab. In addition, you can search the table for specific information.
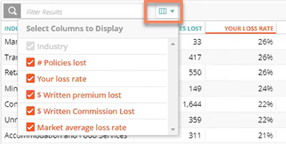
Filter Results
|
|
Note: For Renewing Policies, you can choose from the columns that the Policy Details Export contains in RiskMatch. This is intended to help you add helpful information to the set of renewal policies. |
-
Review your agency’s historical retention performance, benchmarked against other agencies.
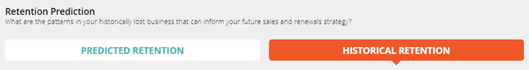
Historical Retention
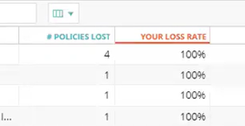
Prior Year Policy Loss
-
Here you will be able to review (left to right):
-
Policy Loss Rate: how many policies were lost during that period
-
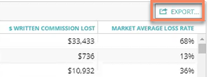
Lost Written Premium: how much premium those policies represented
-
Lost Written Commission: how much commission those policies represented
-
Market Average Loss: the rate of policies not retained, on average, for other agencies
-
Model Accuracy: how well the retention prediction machine learning model predicts whether your policies will be lost or be retained, if no action is taken (see note above).
-
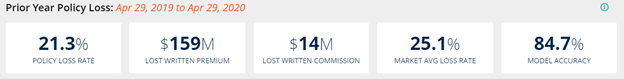
Prior Year Policy Loss
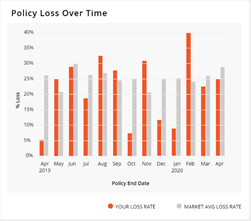
Policy Loss Over Time
-
This graph shows your monthly loss rate (orange) vs. the market average loss rate (gray).
|
|
Note: The end month of the period will be a few months removed from the present to account for data entry activity for renewed policies. |
Policy Loss Over Time
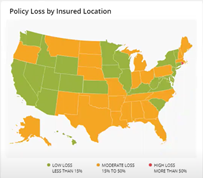
Policy Loss by Insured Location
-
This section is a view of your loss rate by state based on the insured’s location.
-
Red: High Loss (more than 30%)
-
Yellow: Moderate Loss (between 10%-30%, inclusive)
-
Green: Low Loss (less than 10%)
-
-
Hover your cursor over a state to see its loss percentage and the number of policies this represents for that state.
Policy Loss by Insured Location
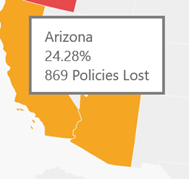
Insured Location Tooltip
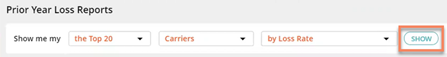
Prior Year Loss Reports
- Drill down into the detail of the past renewals to analyze your agency’s performance from different perspectives.
- Categories:
Top Number
Date View
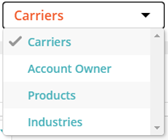
Risk Level

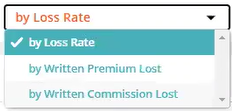
Sorting Criterion
-
When you are ready to view your table click on Show.
Risk Reports
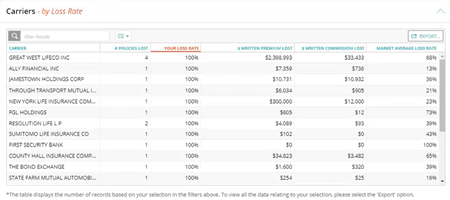
Prior Year Loss Report
-
You can sort by a given column by clicking on the column header. This will be denoted by an orange font setting.
Heading
-
You can also choose to include or exclude certain columns by clicking on the filter results tab. In addition, you can search the table for specific information.

Filter Results
-
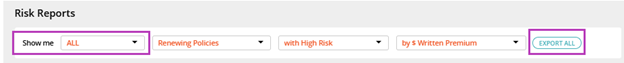
Finally, you can export your report to an Excel spreadsheet by clicking on Export. You can either export your current view or all the data columns included in the table.
|
|
Note: Data displayed in the table are limited to the first 500 rows of any particular view. To access the complete data, you can export the table to Excel. |
Export
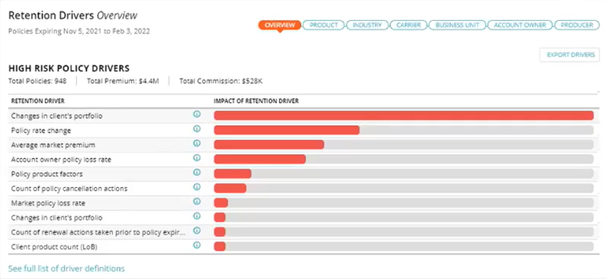
The Retention Prediction dashboard now features a Retention Drivers section that offers the following views:
- Overview
- Industry
- Product
- Carrier
- Business Unit
- Account Owner
- Producer
It will default to the High Risk Policy Drivers graph. Tables that show the top five retention drivers can be seen by selecting views that follow the Overview tab.
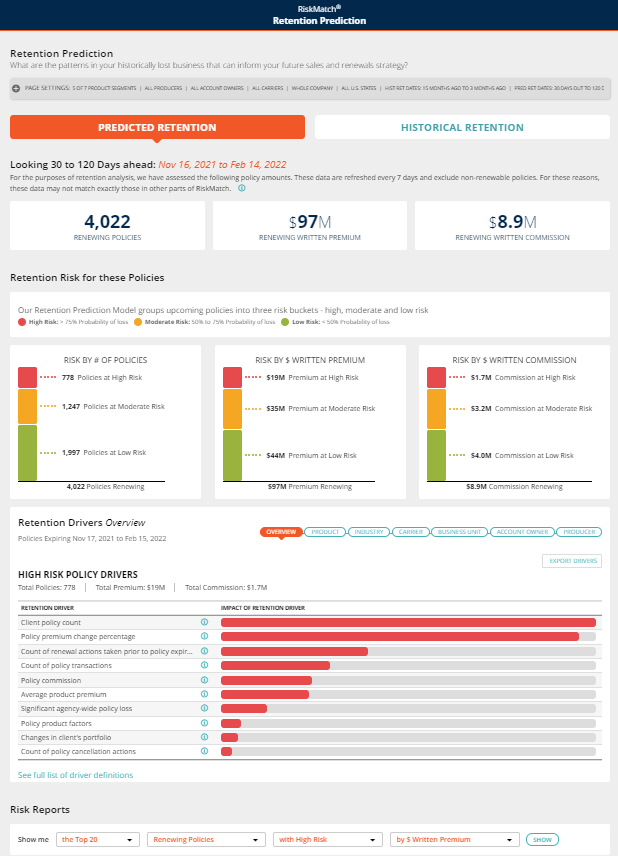
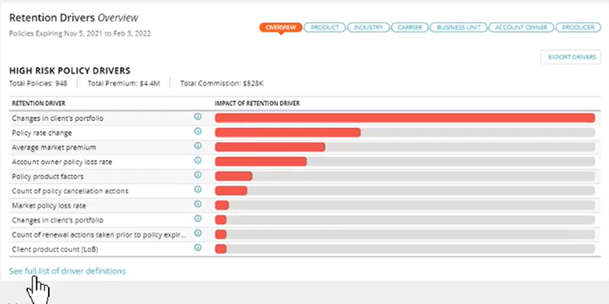
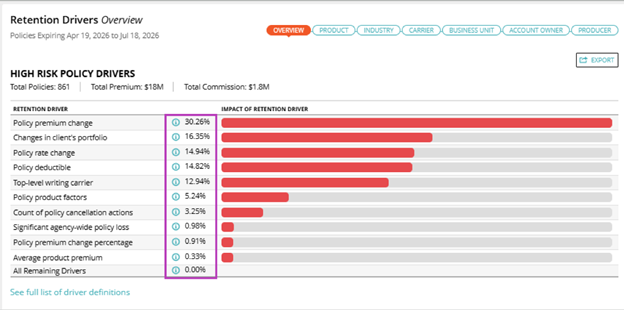
Overview
The Overview highlights retention drivers for high-risk policies. Hovering over the information icon will display the individual retention driver definition.
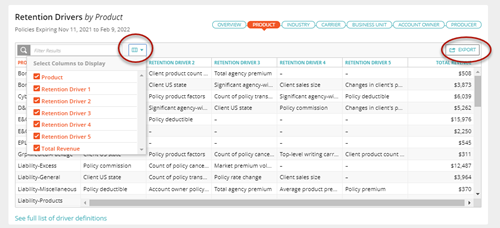
Product
View retention drivers by product.
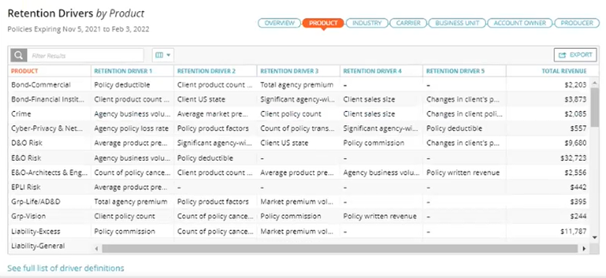
All tables can limit the columns shown by pressing the Select Columns icon. Retention Drivers Revenue Report may be exported to Excel format based on the selected grouping.
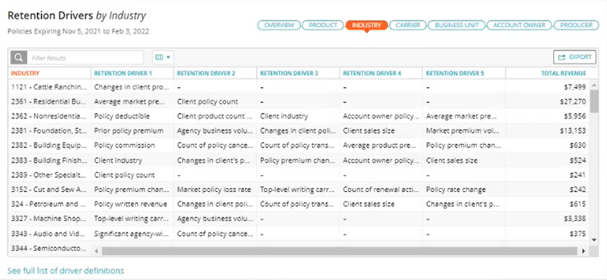
Industry
View retention drivers by industry.
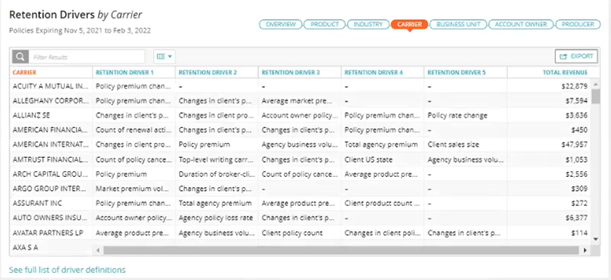
Carrier
View retention drivers by carrier.
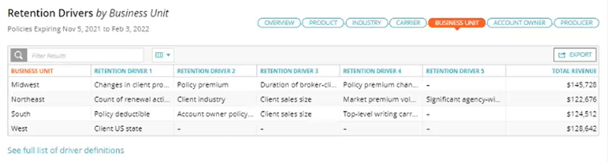
Business Unit
View retention drivers by business unit.
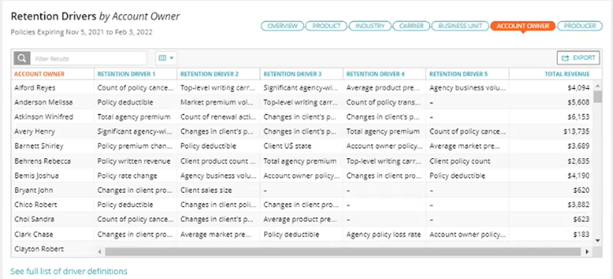
Account Owner
View retention drivers by account owner.
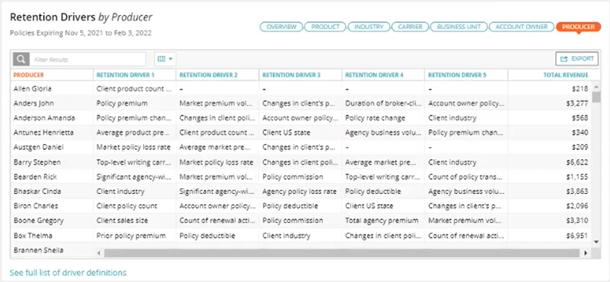
Producer
View retention drivers by producer.
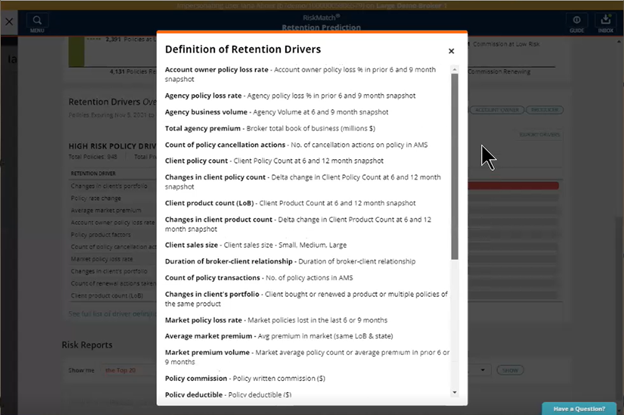
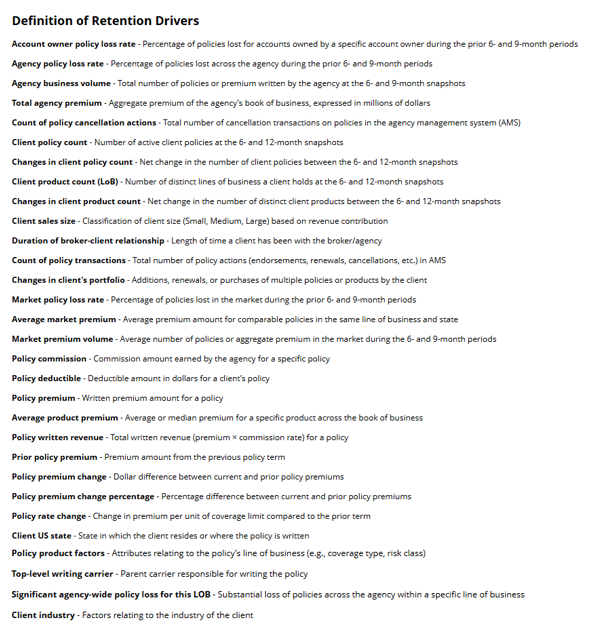
Full list of driver definitions
From any of the above views, you can click the “See full list of driver definitions” link in the bottom left corner to view all driver definitions.
Retention Prediction now features a new Page Settings bar that offers additional filtering capabilities. Users can now filter by:
-
Product Segment
-
Producer
-
Account Owner
-
Carrier
-
Business Division
-
U.S. State
-
Predicted Retention Date Range
-
Historical Retention Date Range
|
|
Note: You must have at least one product segment selected, or you will receive an error message. |
The Page Settings bar is closed on default upon opening the browser. To access the filtering options, click the bar.

Page Settings bar closed on default
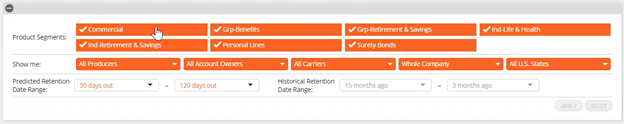
Expanded Page Settings bar
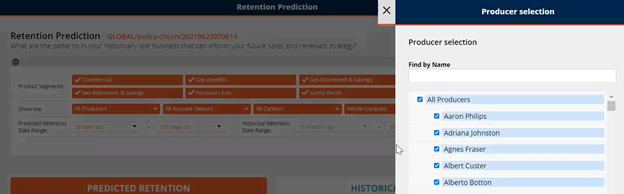
Filtering by Producer
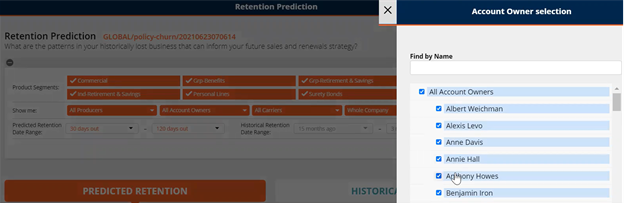
Filtering by Account Owner
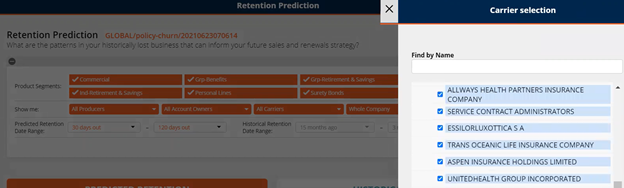
Filtering by Carrier
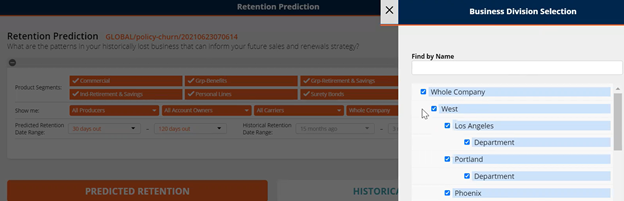
Filtering by Business Division
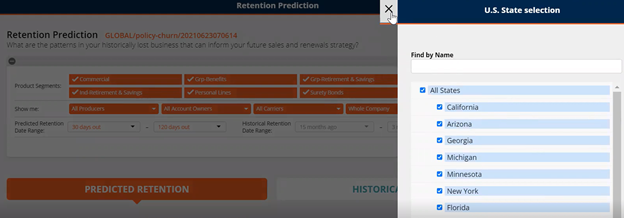
Filtering by U.S. State
You must click Apply to set your selected filters.
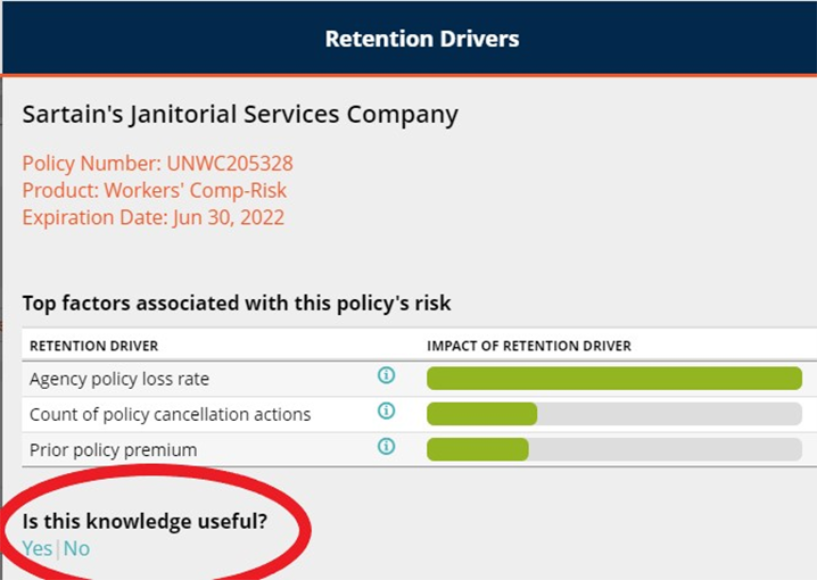
The Risk Reports section now includes retention driver data so users can see why a given policy might be categorized as high risk. To access this data, click the Client name under the Client column of the Top Renewing Policies with High-Risk table.
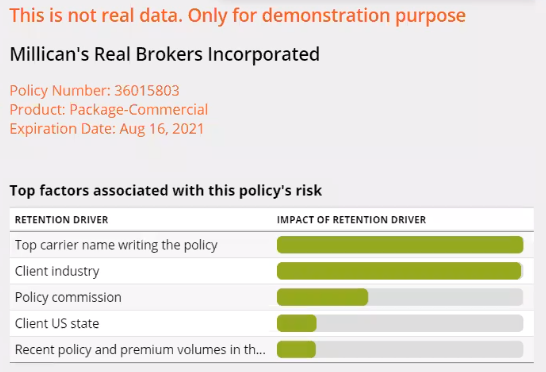
Retention Drivers
Retention Prediction now offers a new Risk Reports view, Clients with Renewals.
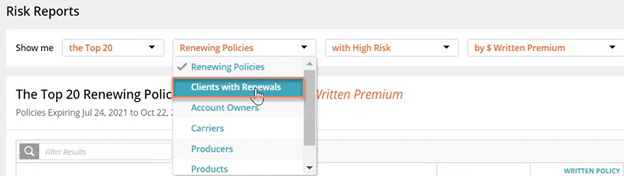
Clients with Renewals view option
For each client, the table includes information for:
-
# of High Risk Policies renewing in the next 30 to 120 days
-
# of Moderate Risk Policies renewing in the next 30 to 120 days
-
# of Low Risk Policies renewing in the next 30 to 120 days
-
Client’s Total Rated Renewals – number of client’s policies renewing in the next 30 to 120 days
-
Client’s Total in-Force Policies – total number of client’s policies placed with agency
-
Rated Renewables Commission – Written commission for policies renewing in next 30 to 120 days
-
Total In-Force Commission – Written
-
Rated Renewable Premium – Written premium for policies renewing in next 30 to 120 days
-
Total In-Force Premium – Written
-
Rated Renewable Revenue – Written revenue for policies renewing in next 30 to 120 days
-
Total In-Force Revenue – Written
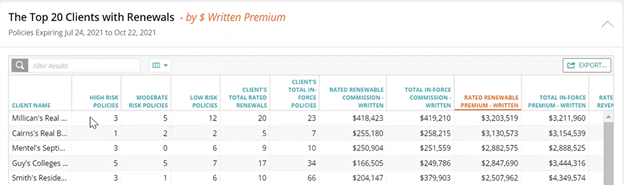
Clients with Renewals view
For optimal performance of the application, we recommend the following as a minimal configuration:
| HARDWARE/SOFTWARE | MINIMUM REQUIREMENTS/RECOMMENDATIONS |
| Processor/CPU Speed |
Recommended: i5, i7 or Multi-core: 2.6 Ghz or above Minimum: Core 2 Duo: 2.3 Ghz or above Not supported: Single Core, Reduced feature CPUs, such as Celeron or AMD Sempron |
| Memory: |
Recommended: 4GB Minimum: 2 GB |
| Hard Drive Space | Minimum: 150Mb of local disc space per user |
| Video | Minimum: Resolution 1024x768 with 16-bit high color or better |
| Operating System |
Recommended: Windows 10 (64-bit) Minimum: Windows 7 (32-bit) |
| Microsoft Office (Word, Excel) |
Recommended: Office 365 *Excel 2010 Professional or higher |
| Microsoft Internet Explorer |
Optimized for Internet Explorer 11 |
| Good Chrome | Latest Version Supported |
| Firefox | Latest Version Supported |
What's New: March 13, 2026
-
High Risk: > 75% Probability of Loss
-
Moderate Risk: 50% to 75% Probability of Loss
-
Low Risk: < 50% Probability of Loss
-
Percentage fields are also added to exports
What's New: March 25, 2022
Users view Retention Drivers at the policy level and determine the accuracy of their impact to account renewal.
Click the Yes|No option to send in-product feedback to the RiskMatch team.
Feedback is reviewed regularly to adjust the model, thus continually providing the most accurate insights on at-risk policies.