Benchmarking Tab for a Broker User
The Benchmarking tab enables you to generate reports to review product characteristics and compare selected prospects or clients with benchmark results. Benchmarking is available for the following lines of coverage: Medical, Dental, Vision, Life and AD&D, Short Term Disability, and Long Term Disability.
The results can be segmented or grouped based on group size (range of FTEs), coverage type, account locations, account industry, or by renewal year. There are two types of benchmarking available: My Firm Benchmarking and Aggregate Benchmarking (for qualified firms).
Both types of benchmarking comprise five BenefitPoint Business Intelligence Executive tab reports: My Firm/Aggregate Benefits Attribute Benchmark, My Firm/Aggregate Contributions Benchmarking, and My Firm Plan Type Benchmark. The Benchmarking Tab is designed as a three-step wizard to help you narrow the data set to be included on the final report. From the Benchmarking Tab you can view multiple benefit attribute distributions in chart and grid format.
Use the Executive Tab benchmarking reports when trying to see specific results, and use the Benchmarking Tab report when reviewing data and looking for trends.
There are two types of benchmarking:
- My Firm Benchmarking: My Firm Benchmarking allows you to benchmark benefit attributes, contributions, and plan type information using only your firm's data (entered in BenefitPoint as of 9 p.m. the previous day). My Firm Benchmarking requires no qualification process and is available to all BenefitPoint broker/consultants as part of their current licenses.
- Aggregate Benchmarking: Aggregate Benchmarking allows you to benchmark benefit attributes, contributions, and plan type information using aggregated data from the BenefitPoint benchmarking data pool. Access to aggregate data requires a qualification process and is available to qualified BenefitPoint broker/consultants as part of their current licenses. Please see BBI Aggregate Benchmarking for details.
Accessing Benchmarking Reports
- From within BenefitPoint, on the top navigation bar click Reports. The Business Intelligence appears in a new window.
- On the top navigation bar click the Benchmarking tab.
Generating Benchmarking Reports
Step 1 of the wizard allows you to pick required and optional parameters to filter the benchmarking results. You can then display the plan distribution using those parameters, enabling you to see which plan types have plans.
- Select the initial parameters for the report to define the data set included and how the data will be grouped.
- Select optional parameters (if applicable) to further limit the data set used to generate the benchmark report. For example, you might want to include plan data for accounts with a main address in California.
- To view the distribution of data by plan, click Show Plan Distribution. To bypass the Plan Distribution parameters, click Skip Plan Distribution.
Step 2 of the wizard allows you to select the number of comparison rows to display on the screen and pick the default Type of Benchmarking, Plan Type, and Benefit Columns that will populate the benefit attributes on the final report.
- Select the Plan Type and respective Benefit column that will pre-populate the Benefit Attributes included in the final benchmark report (you can change the pre-populated values in Step 3 before you generate the report).
- Enter the number of comparison rows to include in the benchmark report. Each Comparison Row displays two benefit attributes, allowing you to visually compare two benefit benchmarks side-by-side. For example, you could compare the in-network and out-of-network values for the same benefit attribute. The number of comparison rows determines how many rows are returned on the report (with two attributes per row).
- For Type of Benchmarking, select Firm or Aggregate to pre-populate the Benefit Attributes included on the report, if applicable. This option only appears if your firm has qualified for aggregate benchmarking (you can change the pre-populated values in Step 3 before you generate the report).
- From the Optional Additional Accounts section, select Optional Additional Accounts (if applicable) to include in the generated Benchmark report. Optional Additional Accounts allow you to see performance of individual accounts vs. My Firm/Aggregate benchmark data. Each selected account appears as a separate row in the final report. If no additional accounts are selected, only My Firm/Aggregate benchmark data is displayed in the final report. You may select up to five additional accounts.
- Click Show Benefit Attributes to view the pre-populated Benefit Attributes based on your selected parameters.
Step 3 of the wizard allows you to adjust the pre-populated Benefit Attributes before you generate the final report. The Benefit Attributes initially displayed are based on your selections in Step 2.
-
For each Benefit Attribute in the report, verify or modify the Type of Benchmarking (if applicable),Plan Type, Benefit Column and Benefit Attribute for each row. You can compare multiple plan types (e.g., Medical HMO to Medical PPO) and Benefit Columns (e.g., In-Network Benefits to Out-of-Network Benefits) in the same report.
-
Click Generate Report to generate the benchmark report based on your selected Benefit Attributes.
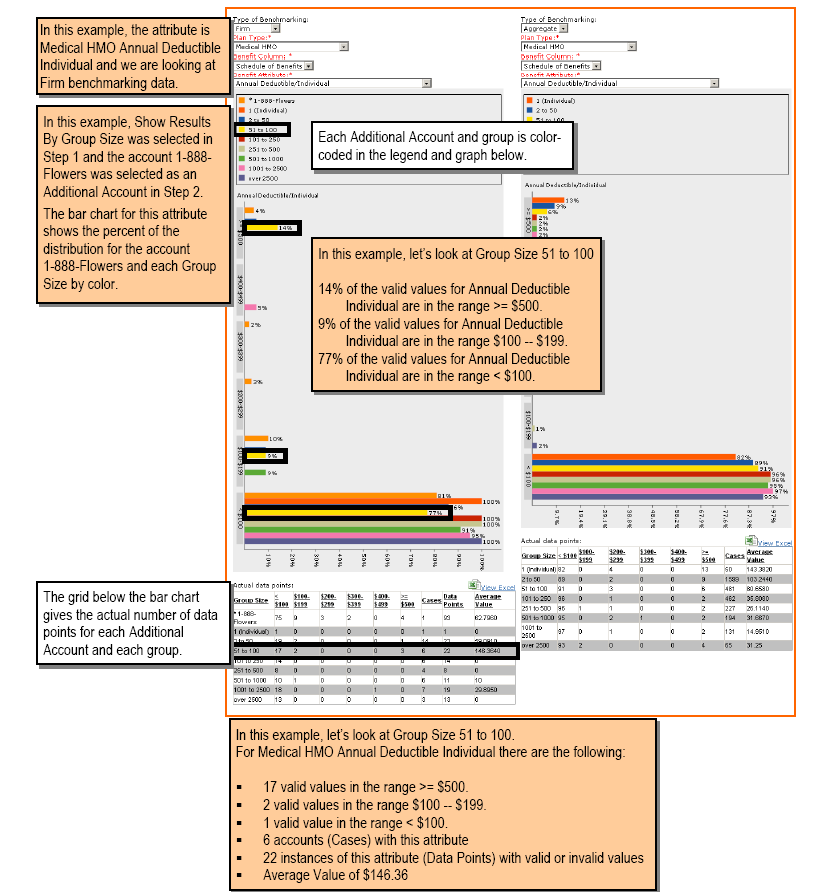
The Benchmark report is displayed based on your selected Benefit Attributes. For each Benefit Attribute, the bar chart shows the percent of the distribution by color for each Additional Account (Firm benchmarking only) and group and the grid below the bar chart gives the actual number of data points per Additional Account (Firm benchmarking only) and group.
- For Print results to PDF, select a format and click View/Save PDF. The report opens in a new window.
If a File Download popup is displayed, click Open or Save and save the report to your hard drive. - From the File menu, select Save As to save the file to your hard drive. Note: To view or print the file, navigate to the file on your hard drive and open in Adobe Acrobat.
- After reviewing the file, select Close from the File menu to close the report.
- To view a grid in Excel, click View Excel to the right of the appropriate grid.
- The report will open in a new window. If a File Download popup is displayed, click Open or Save and save the report to your hard drive.
- From the File menu, select Save As to save the file to your hard drive (to modify or print the file, navigate to the file on your hard drive and open in Microsoft Excel).
- After reviewing the file, select Close from the File menu to close the report.
In order for a plan attribute to be counted in the Benefit Attribute Benchmark reports, the attribute must have a value that matches the valid Unit of Measure (UOM) and falls within the Benchmark Ranges for that attribute as indicated in the Line of Coverage Medical, Dental and Vision tables.
For example, for Annual Deductible/Individual for a Medical HMO plan, a value of $250 would be counted because it has the valid Unit of Measure (UOM) of Dollars ($) and falls within the Benchmark Range of $200-$299. A value of “Not Applicable” (with UOM of Text) would NOT be counted because it does not have the valid Unit of Measure (UOM) of Dollars ($) and therefore does not fall within the acceptable Benchmark Ranges for Annual Deductible/Individual.
When these reports are generated from the Benchmarking tab, you can select multiple benefit attributes and include bar charts along with the grid. To generate a grid in Excel format for a single benefit attribute, select the Executive Tab and select the corresponding Aggregate or My Firm benchmark report.
| REPORT | PROVIDES |
|
Benchmark information (distribution) using BenefitPoint aggregate data for one or more benefit attributes for a single plan year in a grid format. |
|
|
Benchmark contribution values from the aggregate data set to give you a snapshot of common values across industries, account sizes, and account locations. |
|
|
Distribution of contribution values within your firm's book of business. You can see the number of contribution values distributed by two parameters including Group Size, LOC, Plan Type, Account State, Account Industry, and Tier Schedule. |
|
|
Benchmark information (distribution) using your firm's BenefitPoint data for one or more benefit attributes for a single plan year in a grid format. |
|
|
Benchmark information (distribution) using your firm's BenefitPoint data for a single line of coverage and plan year in a grid format. |
|
|
Benchmark benefit attribute values using your firm's data for a single benefit attribute. |