Funnel Chart
Use this process to analyze specific aspects of your quote process.
- Click the Funnel Analysis button.
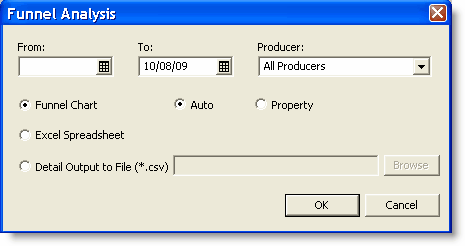
The Funnel Analysis popup window appears.

| field | description |
|---|---|
| From |
Enter the start date for your analysis in mmddyy format. OR Use the |
| To |
This date is always today's date. However, you may change it to fit your needs. Enter the start date for your analysis in mmddyy format. OR Use the |
| Producers |
The default is All Producers. However, if you have Input By completed on the Client View, then you may select specific individuals.
|
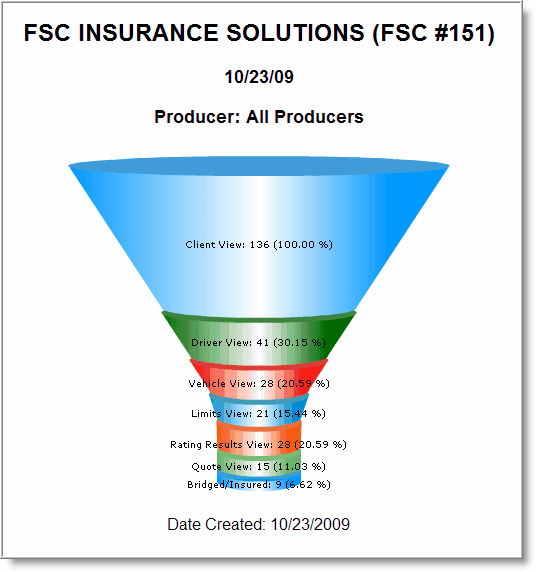
The funnel chart appears showing the total number of quotes and how many got to each stage of the quote process.

That isout of 136 quotes all producers advanced to the Driver View 30.15% of the time, to the Vehicle View 20.59% of the time, and to the Limits and Deductibles View 15.44% of the time, and so on.
This analysis enables agency owners, managers, and producers to effectively track their quoting process regardless if the quote was saved.
This completes the funnel chart.
Continue to Excel Spreadsheet.
Return to Funnel Analysis.
Return to Quote Management Facility.