Production Graphs
Use this feature to generate a production graph.
· Move your mouse over the Reports/Graphs button.
· Click the Production Graphs button.
Selection Criteria Tab
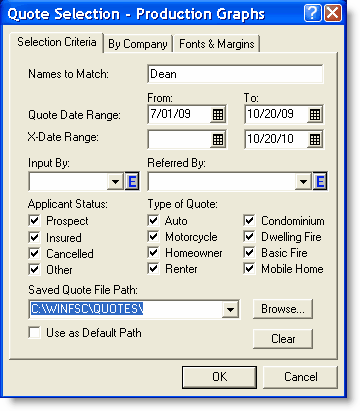
Names to Match:
· Enter first or last name to restrict the list to matching quotes.
Quote Date Range:
· From: Enter the earliest desired quote date or click the calendar.
· To: Enter the latest desired quote date or click the calendar.
X-Date Range:
· From: Enter the earliest desired expiration date or click the calendar.
· To: Enter the latest desired expiration date or click the calendar.
Input By:
If you want only those files entered by a particular person, then
· Enter the name here.
OR
· Click the ![]() .
.
· Click the name you want to use.
Referred By:
If you want only files referred by a particular source, then
· Enter the source here.
OR
· Click the ![]() Icon.
Icon.
· Click the source you want to use.
Applicant Status:
· Click the appropriate status to include in the list of matching files (select as many as apply).
Type of Quote:
· Click the appropriate type of quote to include in the list of matching files (select as many as apply).
Saved Quote File Path:
· Select the file path containing the quotes you wish to select.
OR
· Click Browse and select the path.
Use as Default Path
· Click the box if you want to keep this path for the quotes you wish to select.
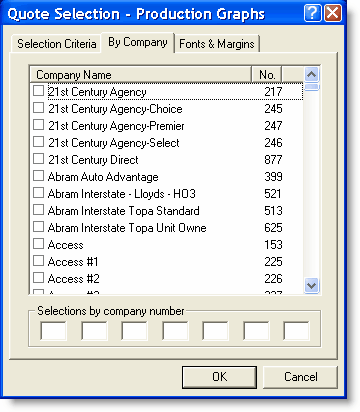
By Company Tab
· Click the appropriate company to help narrow your search.
· Click the Fonts & Margins tab.
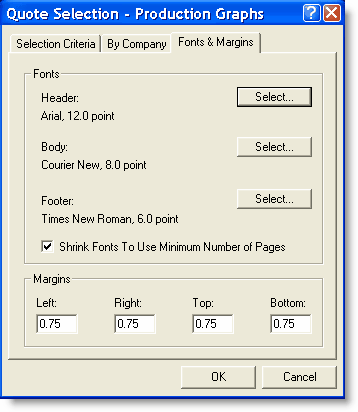
Fonts & Margins
· Make adjustments as desired.
· Click OK.
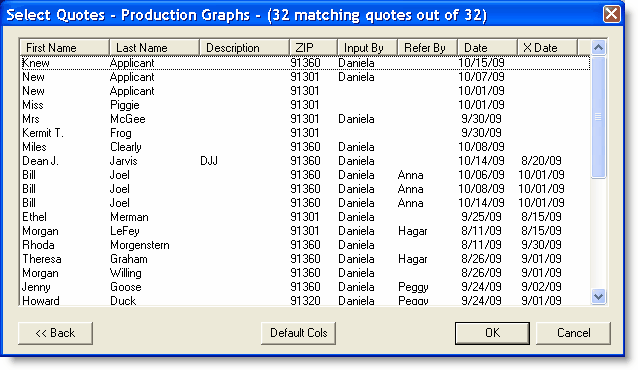
The Production Graphs list matching your criteria appears.
· Select the client you want to graph.
· Click OK.
The graph builds with the criteria you selected.
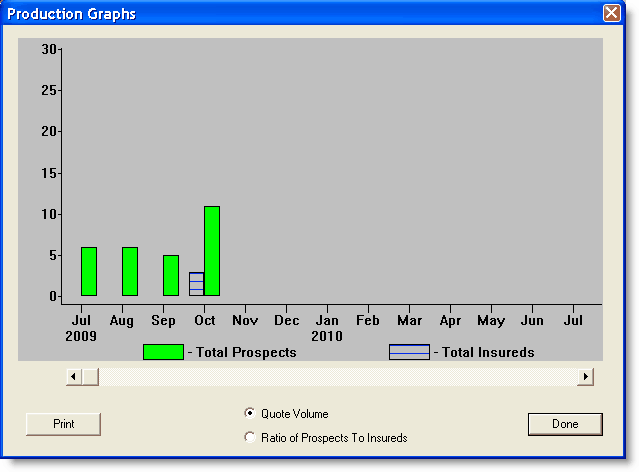
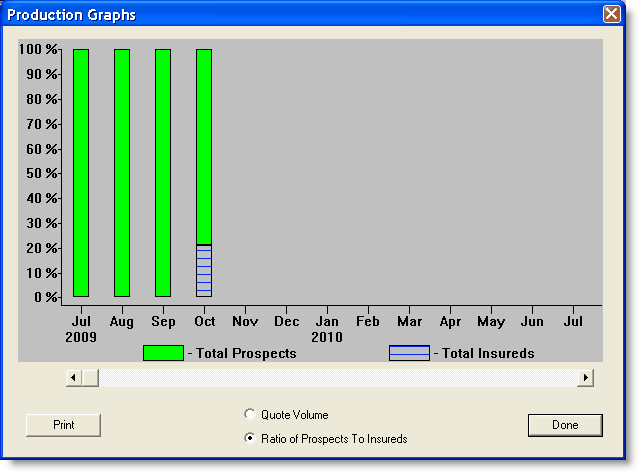
· Select which graph you want to print (either Quote Volume or Ratio of Prospects to Insureds).
Quote Volume
This graph show the number of prospects and the number of insureds with the selected criteria you entered.
Ratio of Prospects to Insureds
This graph shows ratio of prospects to insured per the criteria you selected.
· Click Print to print the graph and quit the program.
OR
· Click Done to exit the program and return to Quote Management Facility.
This completes Production Graphs.
Return to Reports/Graphs.
Return to Quote Management Facility.